
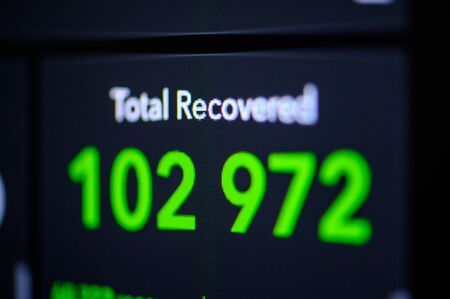
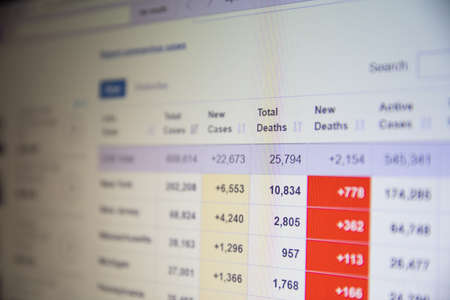
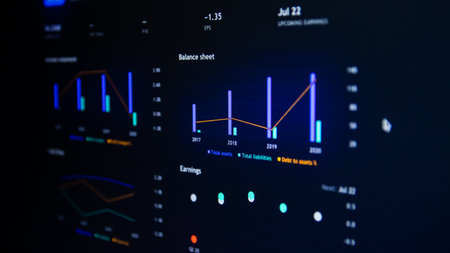
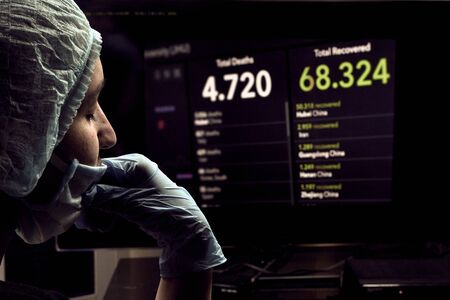
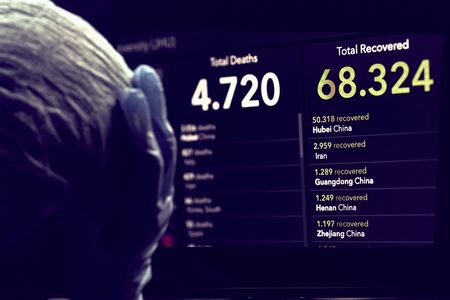
Green Number of Total Recovered from . Coronavirus COVID-19 global cases Map. Red Dot showing the number of infected. Johns Hopkins University map on monitor display.
Коллекция по умолчанию
Коллекция по умолчанию
Создать новую
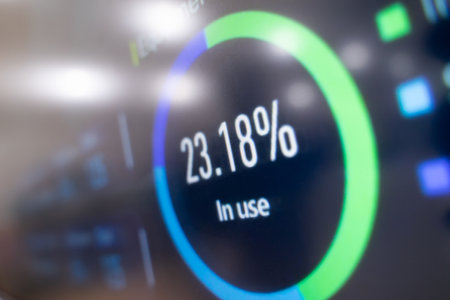
Loading progress bar Load or download and upload circle and speed loader icon. Status or loader progress percentage bar for website or internet page in neon gradient.
Коллекция по умолчанию
Коллекция по умолчанию
Создать новую

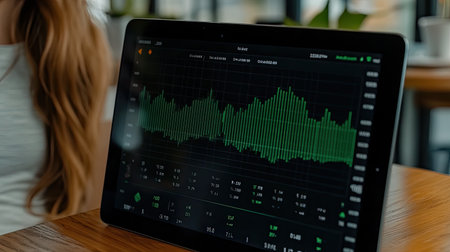
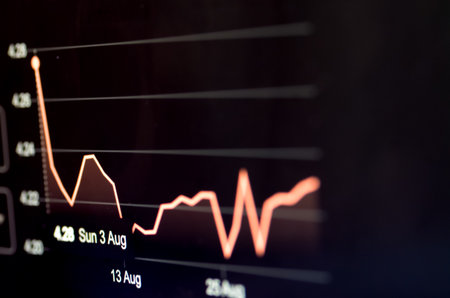
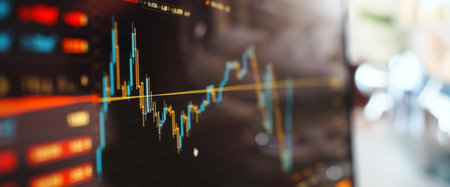
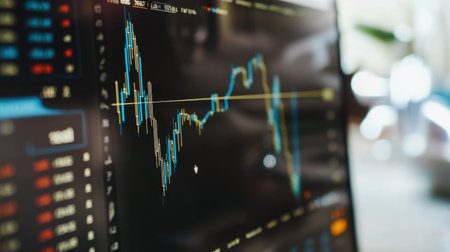
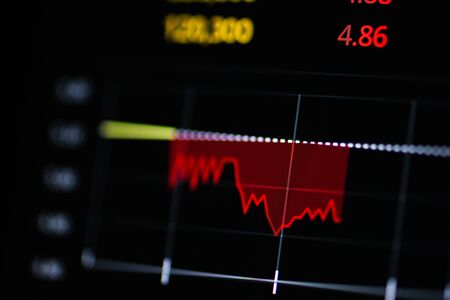
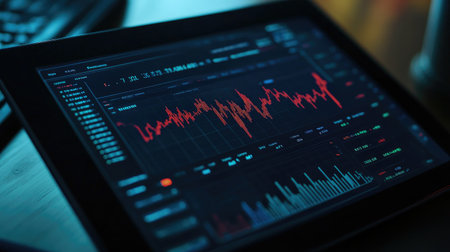
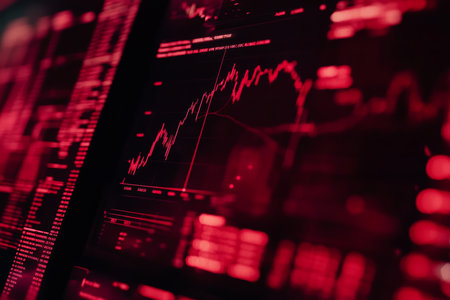
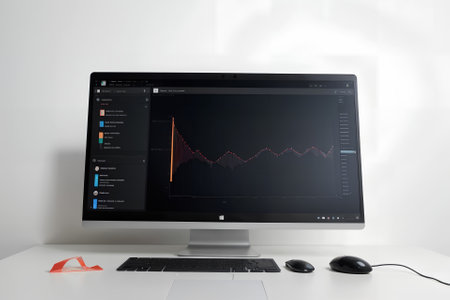
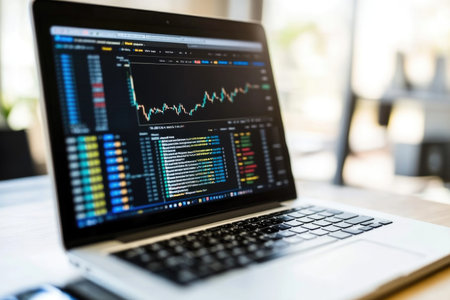
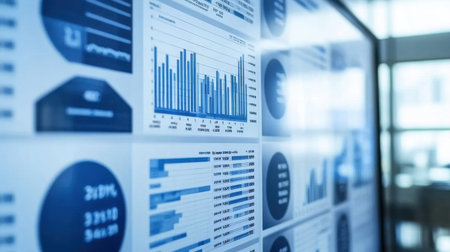
Shallow depth of field (selective focus) with details of a chart showing the stock market crash from March 2020 due to the Covid-19 pandemic on a computer screen (S&P500 index)
Коллекция по умолчанию
Коллекция по умолчанию
Создать новую
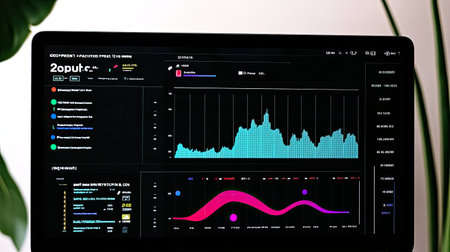
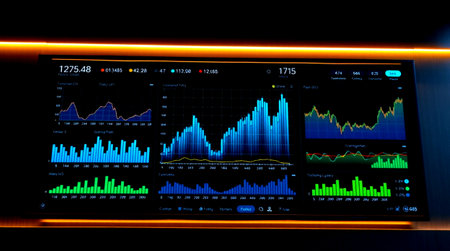
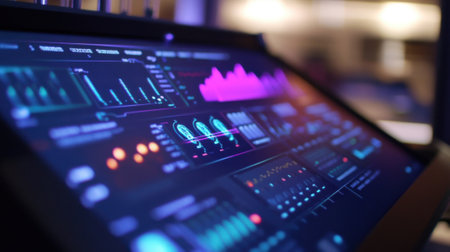
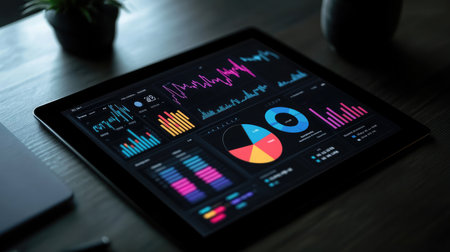
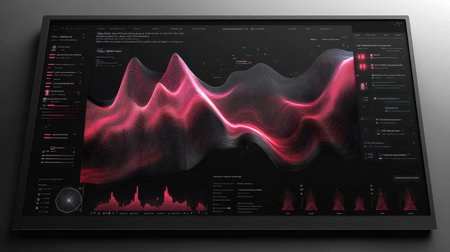
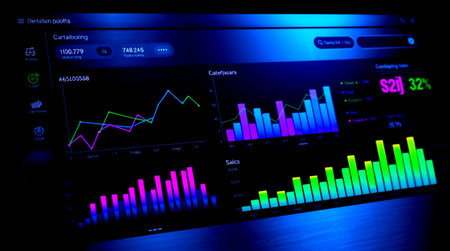
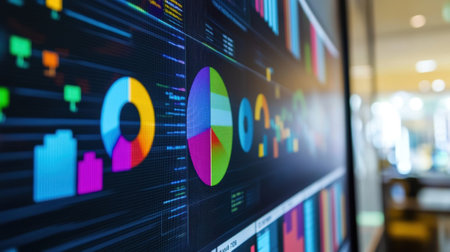
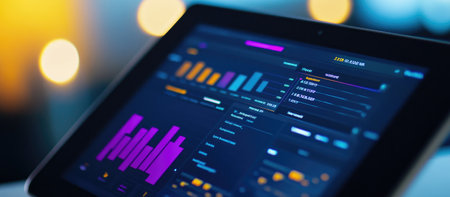
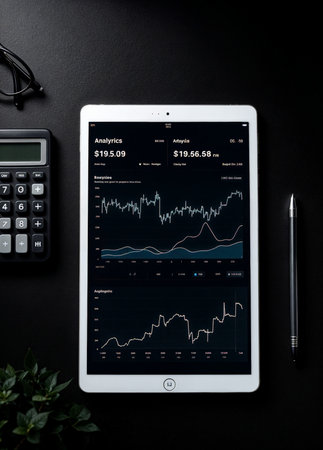
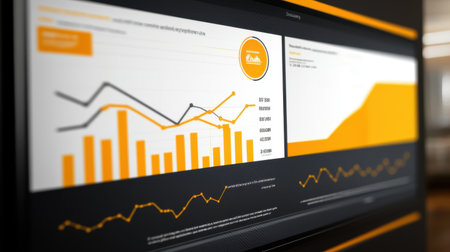
A sleek digital dashboard showcasing market analysis with engaging charts. Ideal for professionals seeking insights into financial performance and trends.
Коллекция по умолчанию
Коллекция по умолчанию
Создать новую
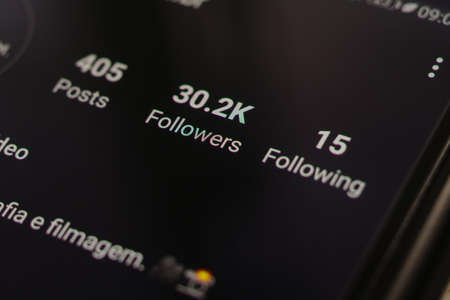
Kuala Lumpur, Malaysia, 24th July 2020: Close up Instagram application menu on smartphone screen. Instagram is a photo and video-sharing social networking service owned by Facebook.
Коллекция по умолчанию
Коллекция по умолчанию
Создать новую
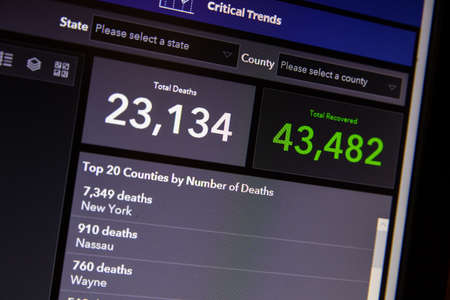
NAMPA, IDAHO - APRIL 14, 2020: John hopkins tracks deaths vs recovery
Коллекция по умолчанию
Коллекция по умолчанию
Создать новую
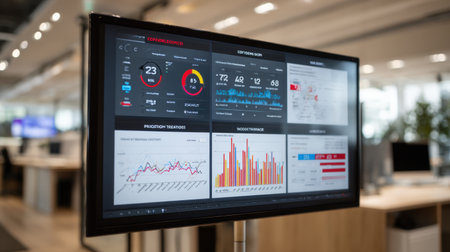
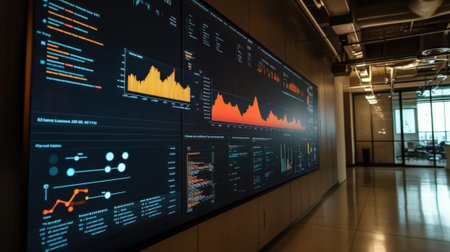
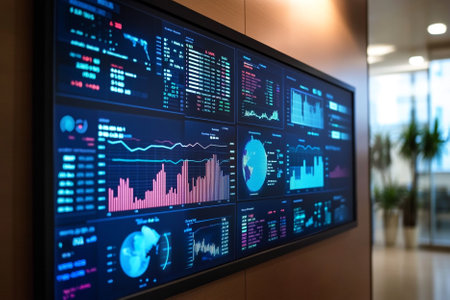
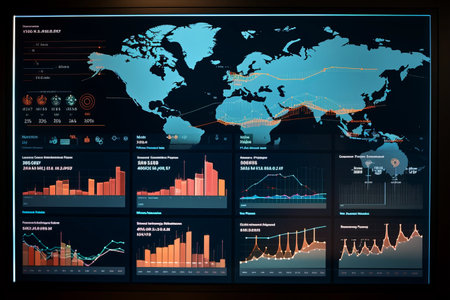
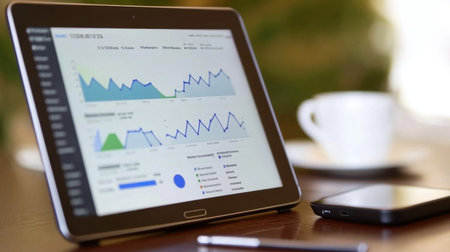
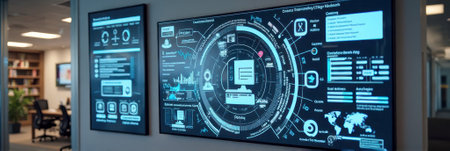
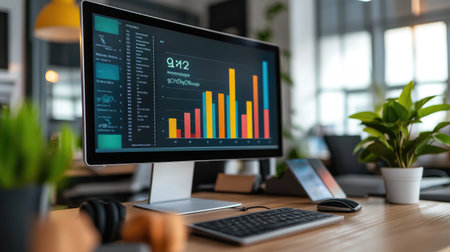
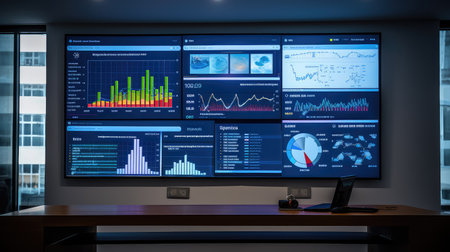
A detailed view of a professional business dashboard showcasing various analytical data on a digital screen in a contemporary office setting, perfect for presentations.
Коллекция по умолчанию
Коллекция по умолчанию
Создать новую
a close up of a menu on a menu
Коллекция по умолчанию
Коллекция по умолчанию
Создать новую
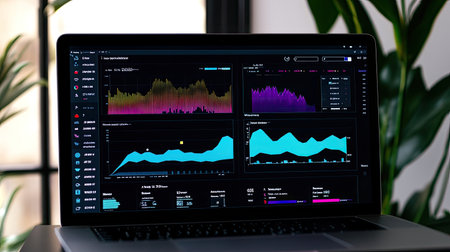
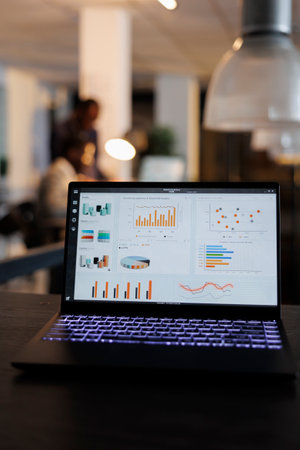
A sleek laptop shows a modern digital dashboard with colorful data visualizations and analytics, set in a contemporary workspace, perfect for business insights.
Коллекция по умолчанию
Коллекция по умолчанию
Создать новую
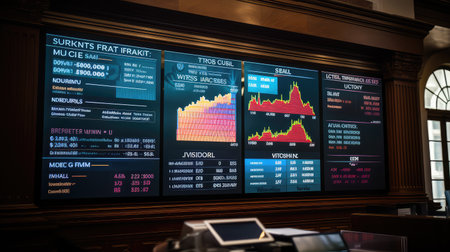
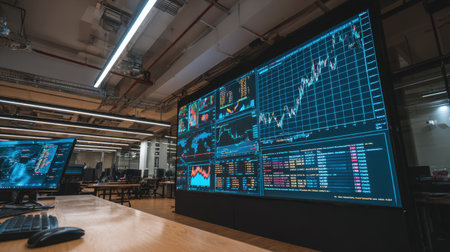
Stock market chart on LED display, stock market data analysis concept.
Коллекция по умолчанию
Коллекция по умолчанию
Создать новую
Close-up of a sophisticated data visualization dashboard featuring various graphs and analytics for monitoring performance and trends in real-time.
Коллекция по умолчанию
Коллекция по умолчанию
Создать новую

Virus pandemic covid-19 map on pc screen, global infection, internet.
Коллекция по умолчанию
Коллекция по умолчанию
Создать новую
A focused shot of a large screen featuring realtime data visualization tools showcasing interactive segments filled with KPIs and metrics. The screen highlights areas of performanc
Коллекция по умолчанию
Коллекция по умолчанию
Создать новую
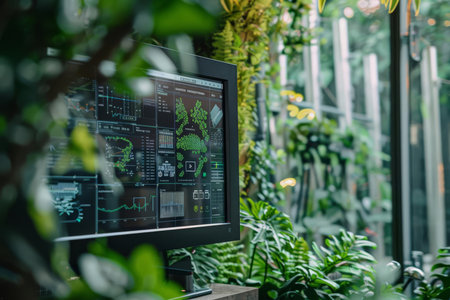
An environmental monitoring station where AI detects changes in ecosystems and predicts weather patterns accurately
Коллекция по умолчанию
Коллекция по умолчанию
Создать новую
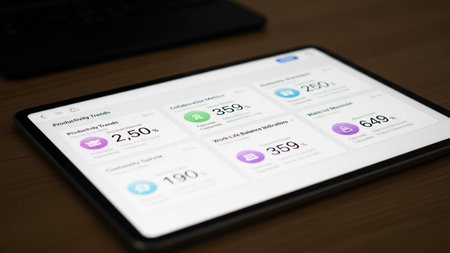
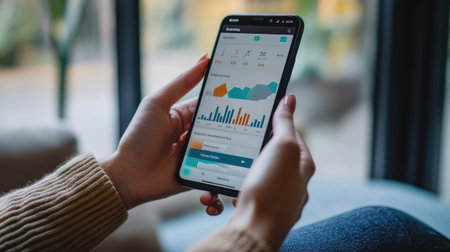
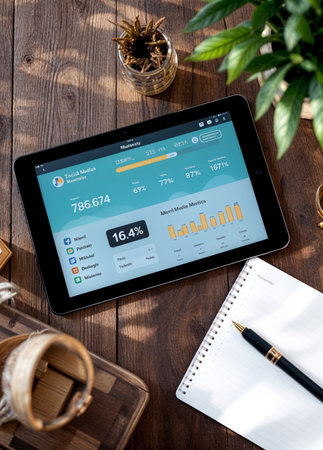
This image shows a tablet device displaying a digital dashboard with various health metrics. The dashboard includes sections for productivity trends, caloric intake, sleep monitoring, work-life balance scores, and step counts. Each section has a visual representation, such as graphs and icons, to provide a clear overview of the user's health and productivity data.
Коллекция по умолчанию
Коллекция по умолчанию
Создать новую
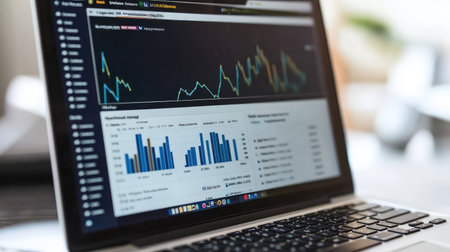
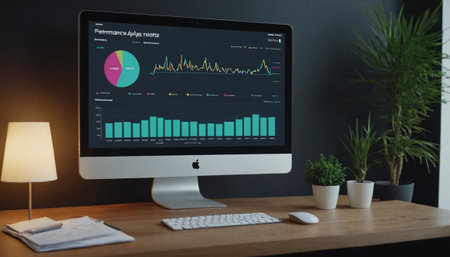
High-resolution image of a sleek data dashboard on a computer monitor showcasing financial analysis with various statistical graphs and trends.
Коллекция по умолчанию
Коллекция по умолчанию
Создать новую
Graphs and charts representing financial metrics and trends are shown on a sleek laptop in a warmly lit room during the evening.
Коллекция по умолчанию
Коллекция по умолчанию
Создать новую
Large screen showing colorful charts and graphs in a dark room
Коллекция по умолчанию
Коллекция по умолчанию
Создать новую
NAMPA, IDAHO - APRIL 14, 2020: Number of deaths as per worldometers website
Коллекция по умолчанию
Коллекция по умолчанию
Создать новую
A close-up of hands holding a smartphone with a banking app, showing a financial graph of account balances and transactions.
Коллекция по умолчанию
Коллекция по умолчанию
Создать новую
Analyzing data on interactive digital screen
Коллекция по умолчанию
Коллекция по умолчанию
Создать новую
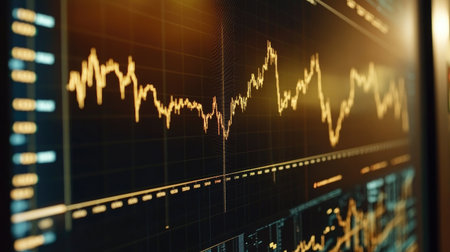
Financial data analyzing on monitor. Abstract financial data analysis on monitor.
Коллекция по умолчанию
Коллекция по умолчанию
Создать новую
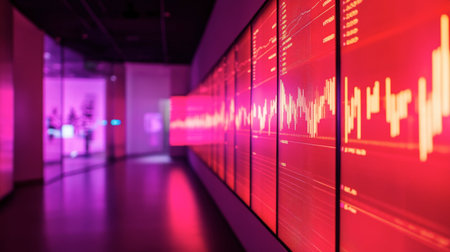
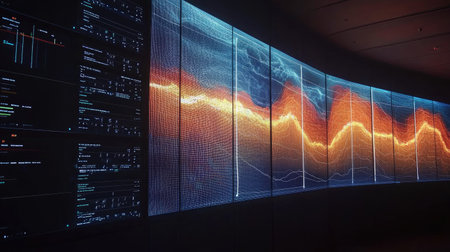
A wall display of financial charts illuminated by LED lights, setting the stage for a corporate celebration.
Коллекция по умолчанию
Коллекция по умолчанию
Создать новую
African Advisor Using KPI Dashboard With Financial Analytics Graphs
Коллекция по умолчанию
Коллекция по умолчанию
Создать новую
Close-up view of a laptop displaying data analysis with charts and graphs, perfect for showcasing technology, finance, or business analytics themes.
Коллекция по умолчанию
Коллекция по умолчанию
Создать новую
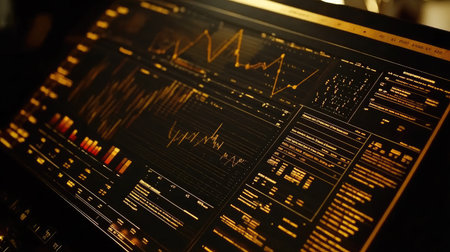
A vibrant image of a large monitor displaying a detailed gold price chart with various technical indicators and a prominent upward trend in gold prices.
Коллекция по умолчанию
Коллекция по умолчанию
Создать новую
case court data
Коллекция по умолчанию
Коллекция по умолчанию
Создать новую
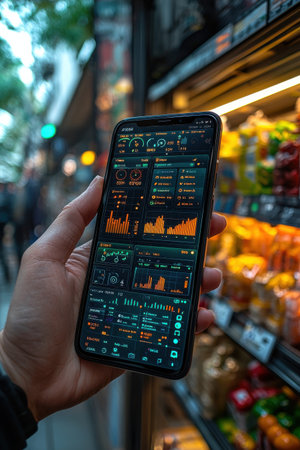
Person Using Smartphone App With Data Analytics Display in Urban Setting
Коллекция по умолчанию
Коллекция по умолчанию
Создать новую
Businessman analyzing investment charts on computer screen in office. Accounting and finance concept
Коллекция по умолчанию
Коллекция по умолчанию
Создать новую
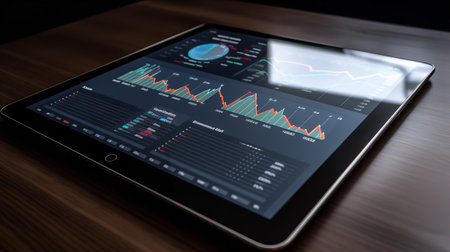
A close-up of graphs and charts displayed on a touch screen tablet, representing data analysis in business operations.
Коллекция по умолчанию
Коллекция по умолчанию
Создать новую
Stock market data on monitor. Business financial graph on monitor screen. Stock market data on monitor. Business financial graph on monitor.
Коллекция по умолчанию
Коллекция по умолчанию
Создать новую
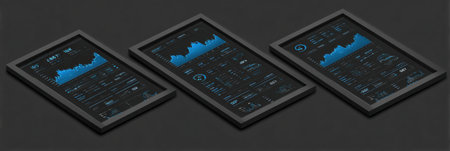
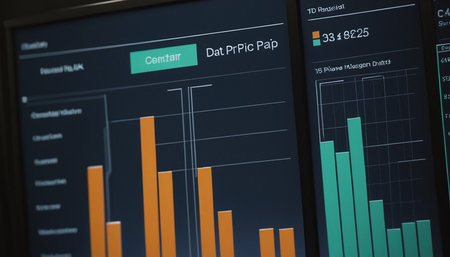
Three digital displays showcase various data visualizations and metrics in a modern design, highlighting trends and statistical analyzes effectively.
Коллекция по умолчанию
Коллекция по умолчанию
Создать новую

Candle stick graph chart with indicator showing bullish point or bearish point, up trend or down trend of price of stock market or stock exchange trading, investment and financial concept.
Коллекция по умолчанию
Коллекция по умолчанию
Создать новую

Sales profit numbers changing on monitor after global trade, real time exchange market stocks statistics growing. Financial graphs showing money trend, risk buying. Close up. Tripod shot.
Коллекция по умолчанию
Коллекция по умолчанию
Создать новую
Stock market or forex trading graph and candlestick chart suitable for financial investment concept. Economy trends background for business idea and all art work design.
Коллекция по умолчанию
Коллекция по умолчанию
Создать новую
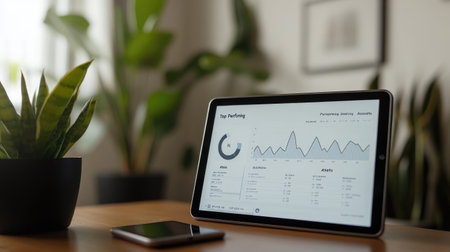
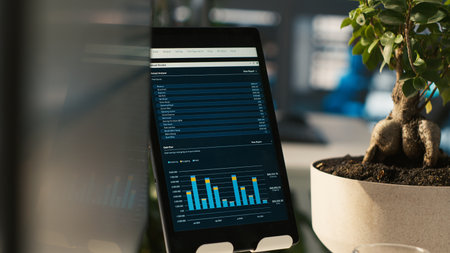
A modern workspace featuring a tablet displaying data analysis surrounded by indoor plants, creating a focus on productivity and innovation in a clean, professional environment.
Коллекция по умолчанию
Коллекция по умолчанию
Создать новую
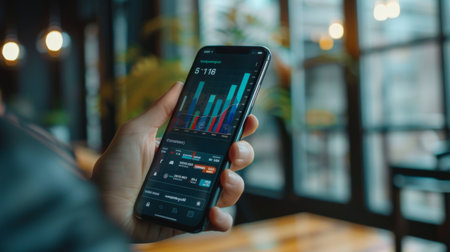
A close-up of a rising stock chart on a tablet screen, showing significant investment growth.
Коллекция по умолчанию
Коллекция по умолчанию
Создать новую
A tablet displaying a pie chart with various investment categories, emphasizing diversification in financial planning
Коллекция по умолчанию
Коллекция по умолчанию
Создать новую
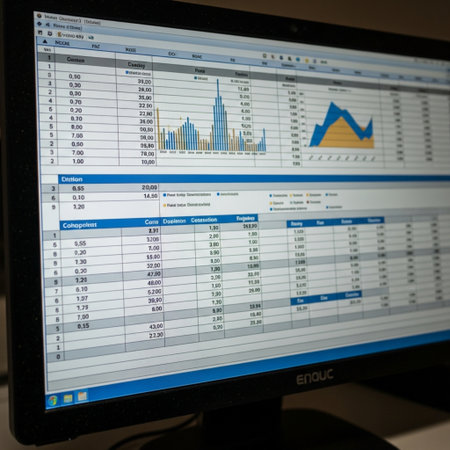
Digital Finance: Analyzing Volatile Market Graphs and Managing Tiered Compensation Schedules on a Desktop.
Коллекция по умолчанию
Коллекция по умолчанию
Создать новую
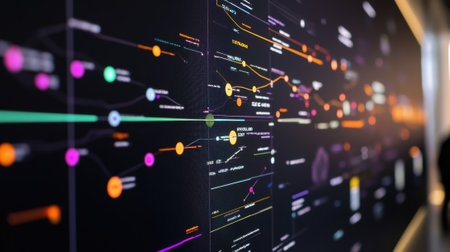
Futuristic AI interface visualizing deep learning with layered algorithm diagrams
Коллекция по умолчанию
Коллекция по умолчанию
Создать новую
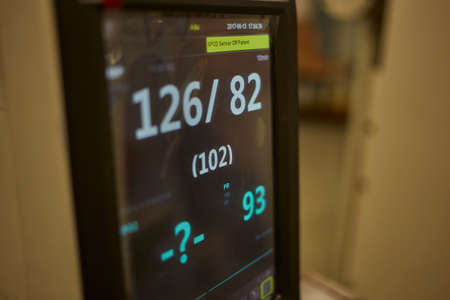
Medical digital blood pressure monitor
Коллекция по умолчанию
Коллекция по умолчанию
Создать новую
Abstract image of financial data and stock market analysis with colorful graphs and charts, representing economic trends and market fluctuations.
Коллекция по умолчанию
Коллекция по умолчанию
Создать новую
The scene presents clean, structured analytics visuals that clearly communicate performance tracking, growth measurement, and data-driven decision-making
Коллекция по умолчанию
Коллекция по умолчанию
Создать новую
digital tablet screen showing a financial charts and graphs with empty note book and pen is on a wooden table
Коллекция по умолчанию
Коллекция по умолчанию
Создать новую
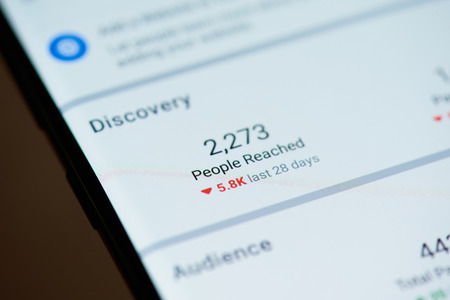
New york, USA - october 4, 2018: People reached in facebook post on smartphone screen close up view
Коллекция по умолчанию
Коллекция по умолчанию
Создать новую
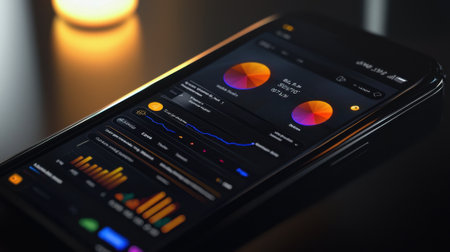
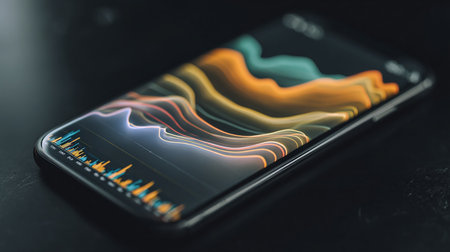
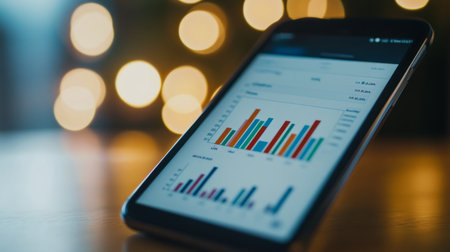
A sleek smartphone shows vibrant data charts and graphs against a dark background. The device captures attention with its user-friendly interface and illuminated ambiance.
Коллекция по умолчанию
Коллекция по умолчанию
Создать новую

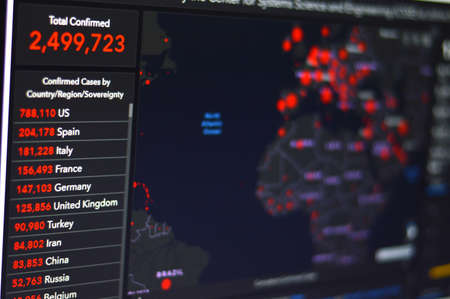
Statistics compare total number of deaths from Corona Virus sorted according to the country name and region.. selective focus
Коллекция по умолчанию
Коллекция по умолчанию
Создать новую

Female doctor worked around the clock to save lives. Doctor cry and feel unhappy with covid-19 rapid spread and growing number of deaths. Nurse watching TV news about coronavirus. Exhausted doctor
Коллекция по умолчанию
Коллекция по умолчанию
Создать новую
A financial chart illustrates a notable surge in stock market profits, fueled by rising interest rates and consistent growth in money investments during recent months.
Коллекция по умолчанию
Коллекция по умолчанию
Создать новую
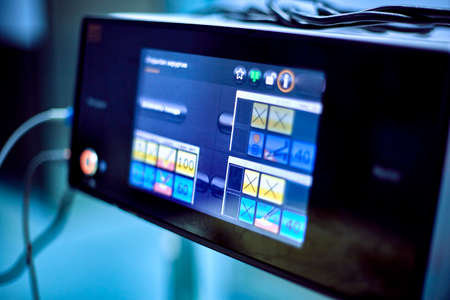
electronic device, monitor in the operating room
Коллекция по умолчанию
Коллекция по умолчанию
Создать новую
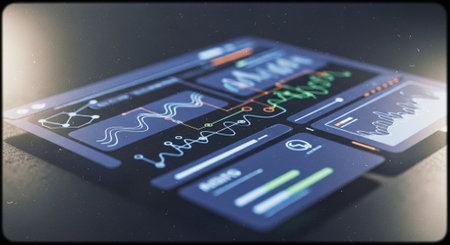
Futuristic dashboard with financial data on a dark background. The concept of business analysis and planning.
Коллекция по умолчанию
Коллекция по умолчанию
Создать новую
Close up of tablet screen on desk displaying financial graphs of company profits performance metrics. Data analytics on device display showing corporate business earnings KPIs
Коллекция по умолчанию
Коллекция по умолчанию
Создать новую
View of Stock Market Crash from Covid-19 Pandemic with shallow depth of field.
Коллекция по умолчанию
Коллекция по умолчанию
Создать новую
This image showcases a modern digital data visualization environment, featuring colorful graphs on multiple screens, reflecting trends, patterns, and coding interfaces.
Коллекция по умолчанию
Коллекция по умолчанию
Создать новую
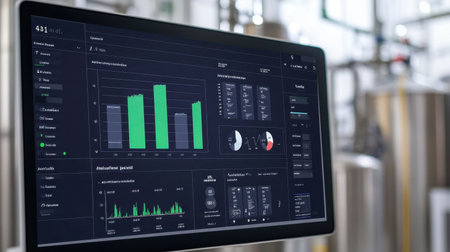
A vibrant mix of pie charts and line graphs on a large monitor illustrating the synthesis of operational data trends from various departments within a factory setting
Коллекция по умолчанию
Коллекция по умолчанию
Создать новую
Laptop computer with marketing statistics graphs on screen, standing on table in startup office, coworkers discussing company strategy in background. Employees working overtime in startup office
Коллекция по умолчанию
Коллекция по умолчанию
Создать новую
Unleashing Business Insights: Exploring a Virtual Screen with an Interactive Business Intelligence Analyst Dashboard and Spectacular Big Data Graphs and Charts
Коллекция по умолчанию
Коллекция по умолчанию
Создать новую
Detailed shot of a stock chart with market trends and performance metrics displayed on a tablet or laptop
Коллекция по умолчанию
Коллекция по умолчанию
Создать новую
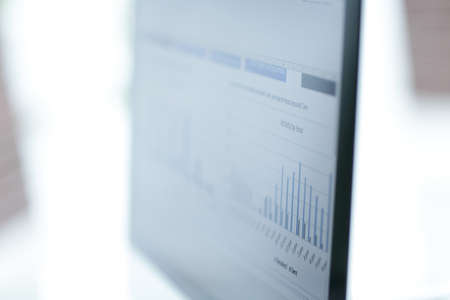
financial chart on a computer monitor, closeup photo with shallow depth of field
Коллекция по умолчанию
Коллекция по умолчанию
Создать новую
A close-up of a tablet displaying a marketing automation dashboard, with workflows and email campaigns in progress. . --ar 16:7 --v 6.1 Job ID: 6394e9d2-fafa-4b8e-bdb9-709c6efc044f
Коллекция по умолчанию
Коллекция по умолчанию
Создать новую

Online stock exchange application with information on screen, closeup
Коллекция по умолчанию
Коллекция по умолчанию
Создать новую

Financial data on a monitor,Stock market data on LED display concept
Коллекция по умолчанию
Коллекция по умолчанию
Создать новую
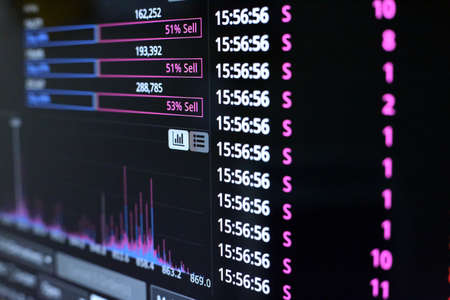
Thailand Stock Exchange, Streaming Trade Screen, The stock screen shows a list of stocks with reduced value.
Коллекция по умолчанию
Коллекция по умолчанию
Создать новую
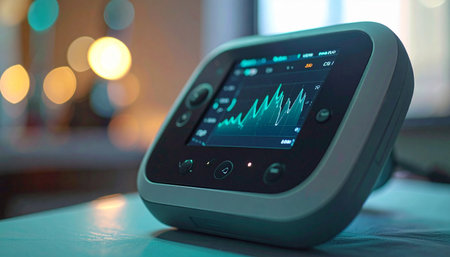
A state-of-the-art portable ventilator rests on a table, its screen glowing with vital respiratory data. In the soft-focus background, warm lights create a calm atmosphere, blending advanced medical technology with a sense of home care and hope.
Коллекция по умолчанию
Коллекция по умолчанию
Создать новую
Tablet pc with stock market graphs on screen and office supplies on black table
Коллекция по умолчанию
Коллекция по умолчанию
Создать новую
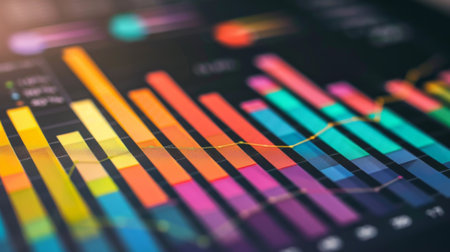
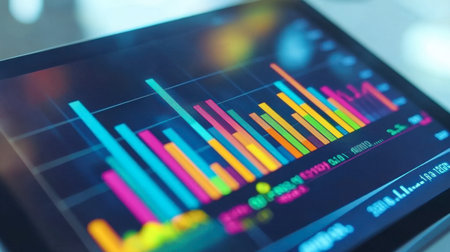
A colorful bar chart showing quarterly sales growth for a tech startup, with upward trends highlighted
Коллекция по умолчанию
Коллекция по умолчанию
Создать новую
This image features a tablet showcasing financial graphs and charts, set on a desk beside a smartphone and coffee cup, offering an ideal visual for business analytics.
Коллекция по умолчанию
Коллекция по умолчанию
Создать новую
Futuristic touch user interface. 3d rendering toned image
Коллекция по умолчанию
Коллекция по умолчанию
Создать новую
Futuristic office displays with interactive data and graphical interfaces. That the image is generated using AI.
Коллекция по умолчанию
Коллекция по умолчанию
Создать новую
Bright and colorful data visualization displayed on a tablet screen, showcasing key statistics and trends for effective business analysis and decision-making.
Коллекция по умолчанию
Коллекция по умолчанию
Создать новую
Female doctor worked around the clock to save lives. Doctor cry and feel unhappy with covid-19 rapid spread and growing number of deaths. Nurse watching TV news about coronavirus. Exhausted doctor
Коллекция по умолчанию
Коллекция по умолчанию
Создать новую

Current weather display interface on a modern digital display showing cold weather Tilt-shift lens used to outline the cold -22 symbols
Коллекция по умолчанию
Коллекция по умолчанию
Создать новую
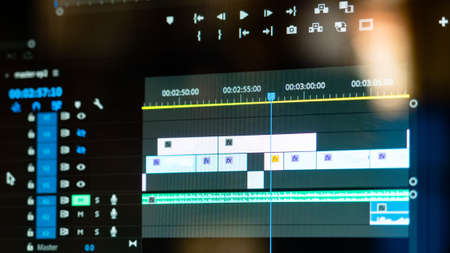
video editting timeline
Коллекция по умолчанию
Коллекция по умолчанию
Создать новую
A modern financial office featuring large display screens with stock market trends and analytics, showcasing real-time data in a sleek and contemporary environment.
Коллекция по умолчанию
Коллекция по умолчанию
Создать новую
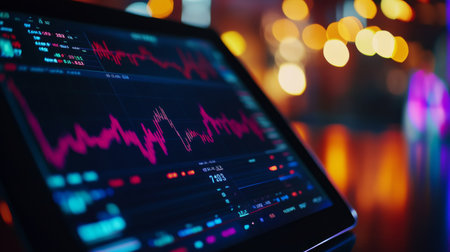
Dynamic digital interface illustrating stock market trends with red highlights and data analysis
Коллекция по умолчанию
Коллекция по умолчанию
Создать новую
Female doctor worked around the clock to save lives. Doctor cry and feel unhappy with covid-19 rapid spread and growing number of deaths. Nurse watching TV news about coronavirus. Exhausted doctor
Коллекция по умолчанию
Коллекция по умолчанию
Создать новую
A smartphone screen showing a financial app with a detailed bar graph, held by a businessperson.
Коллекция по умолчанию
Коллекция по умолчанию
Создать новую
Insightful Digital Market Analysis by Alex Turner AI Generated.
Коллекция по умолчанию
Коллекция по умолчанию
Создать новую
Smartphone with a graph on the screen on a dark background.
Коллекция по умолчанию
Коллекция по умолчанию
Создать новую
A modern professional workspace showcasing a desktop computer with colorful data visualizations on the screen. Ideal for business, finance, and analysis themes.
Коллекция по умолчанию
Коллекция по умолчанию
Создать новую
close-up of a personal computer screen. Business background
Коллекция по умолчанию
Коллекция по умолчанию
Создать новую

image of the financial graph on a computer monitor.
Коллекция по умолчанию
Коллекция по умолчанию
Создать новую
data procurement technology
Коллекция по умолчанию
Коллекция по умолчанию
Создать новую
Pitch deck presentation visuals with startup growth timeline and user acquisition plan
Коллекция по умолчанию
Коллекция по умолчанию
Создать новую
Factory dashboard with real-time alerts, maintenance schedule, and energy usage displayed
Коллекция по умолчанию
Коллекция по умолчанию
Создать новую

Laptop showcasing dynamic data visualizations with colorful graphs. The device is placed amidst flowers under illuminated skies at night. Clear view of the screen highlights analytical insights.
Коллекция по умолчанию
Коллекция по умолчанию
Создать новую
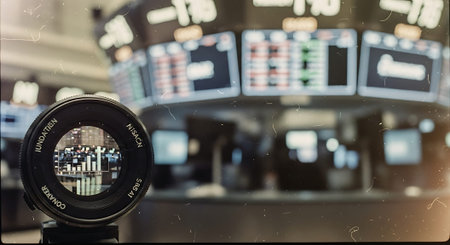
A macro shot of a camera lens focusing on a stock market display board showing financial data and graphs.
Коллекция по умолчанию
Коллекция по умолчанию
Создать новую
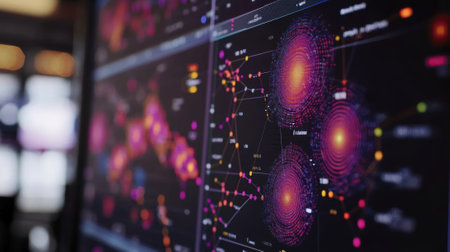
Big data analysis showing colorful circular diagrams on multiple computer screens
Коллекция по умолчанию
Коллекция по умолчанию
Создать новую
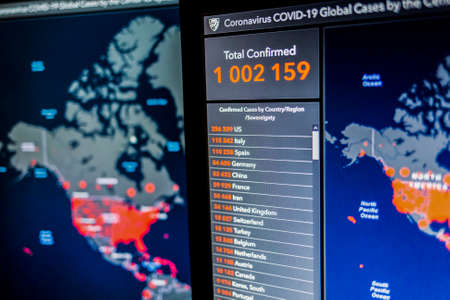
Over 1 million. Number of Total Confirmed Cases. Coronavirus COVID-19 global cases Map Johns Hopkins University map on monitor display.
Коллекция по умолчанию
Коллекция по умолчанию
Создать новую
Zoomed in on a screen showing a colorcoded timeline that visualizes shifts in consumer demand overlaid with alerts for immediate adjustments to production schedules
Коллекция по умолчанию
Коллекция по умолчанию
Создать новую
displays the development of the covid-19 outbreak throughout the official website on an online computer, Tarakan - Indonesia 21 April 2020
Коллекция по умолчанию
Коллекция по умолчанию
Создать новую
A close-up of a bar chart on a smartphone screen, with financial data and trends visible, showcasing the ease of accessing financial information on the go.
Коллекция по умолчанию
Коллекция по умолчанию
Создать новую
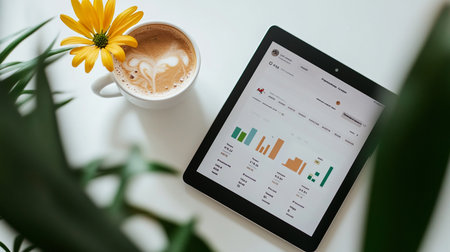
Tablet pc showing charts on screen and a cup of cappuccino
Коллекция по умолчанию
Коллекция по умолчанию
Создать новую
A high-resolution image of a financial graph on a tablet, showing real-time market data and trends with a focus on sharp, clear details.
Коллекция по умолчанию
Коллекция по умолчанию
Создать новую
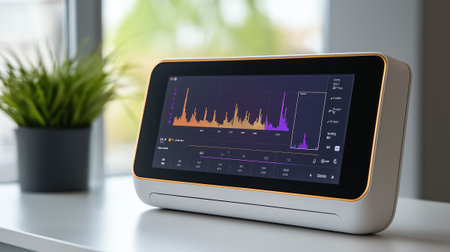
Smart display features vibrant data analysis with colorful graphs. Clean white sleek design complements green plant. Concept of technology, data visualization, home office.
Коллекция по умолчанию
Коллекция по умолчанию
Создать новую
Minimalist Financial Analysis on Laptop with Stock Market Charts.
Коллекция по умолчанию
Коллекция по умолчанию
Создать новую
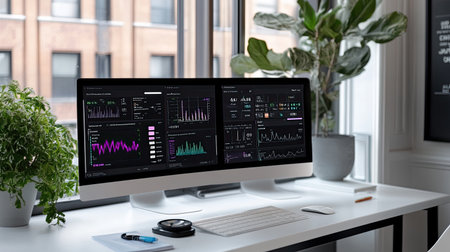
A stylish workspace featuring two monitors displaying vibrant data analytics dashboards. The setup combines technology with a cozy atmosphere, ideal for productivity.
Коллекция по умолчанию
Коллекция по умолчанию
Создать новую
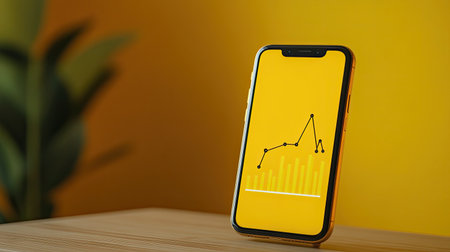
A smartphone with a growing market graph, signifying the growth of new business opportunities.
Коллекция по умолчанию
Коллекция по умолчанию
Создать новую
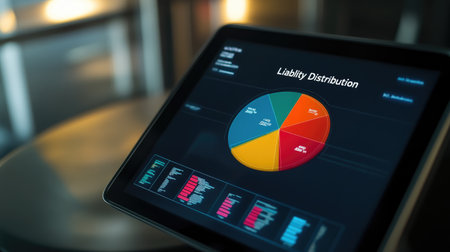
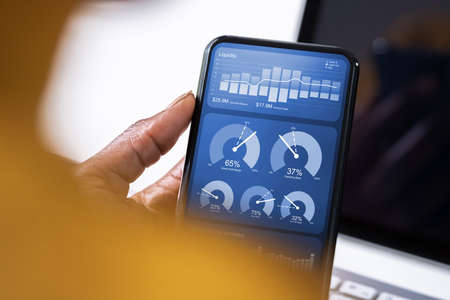
A sleek tablet showcases a vibrant liability distribution chart, illustrating critical business analytics in a modern workspace setting.
Коллекция по умолчанию
Коллекция по умолчанию
Создать новую
A modern office scene featuring a digital display of business analytics, showcasing various statistical graphs and charts vital for decision-making and strategic planning.
Коллекция по умолчанию
Коллекция по умолчанию
Создать новую
Legion-Media
Создайте свои проекты на основе качественных стоковых фотографий и видео.


Copyright © Legion-Media.